Product Analytics Blueprint
A blueprint for product analytics. A bottom-up process designed to convert raw data into validated insights that directly inform product strategy, tactics, and roadmap.
This blueprint is the analytical engine for evidence-based product decisions. It moves from foundational understanding to rigorous testing and finally to strategic implementation, organized into three core layers:
Theory → Inference → Activation
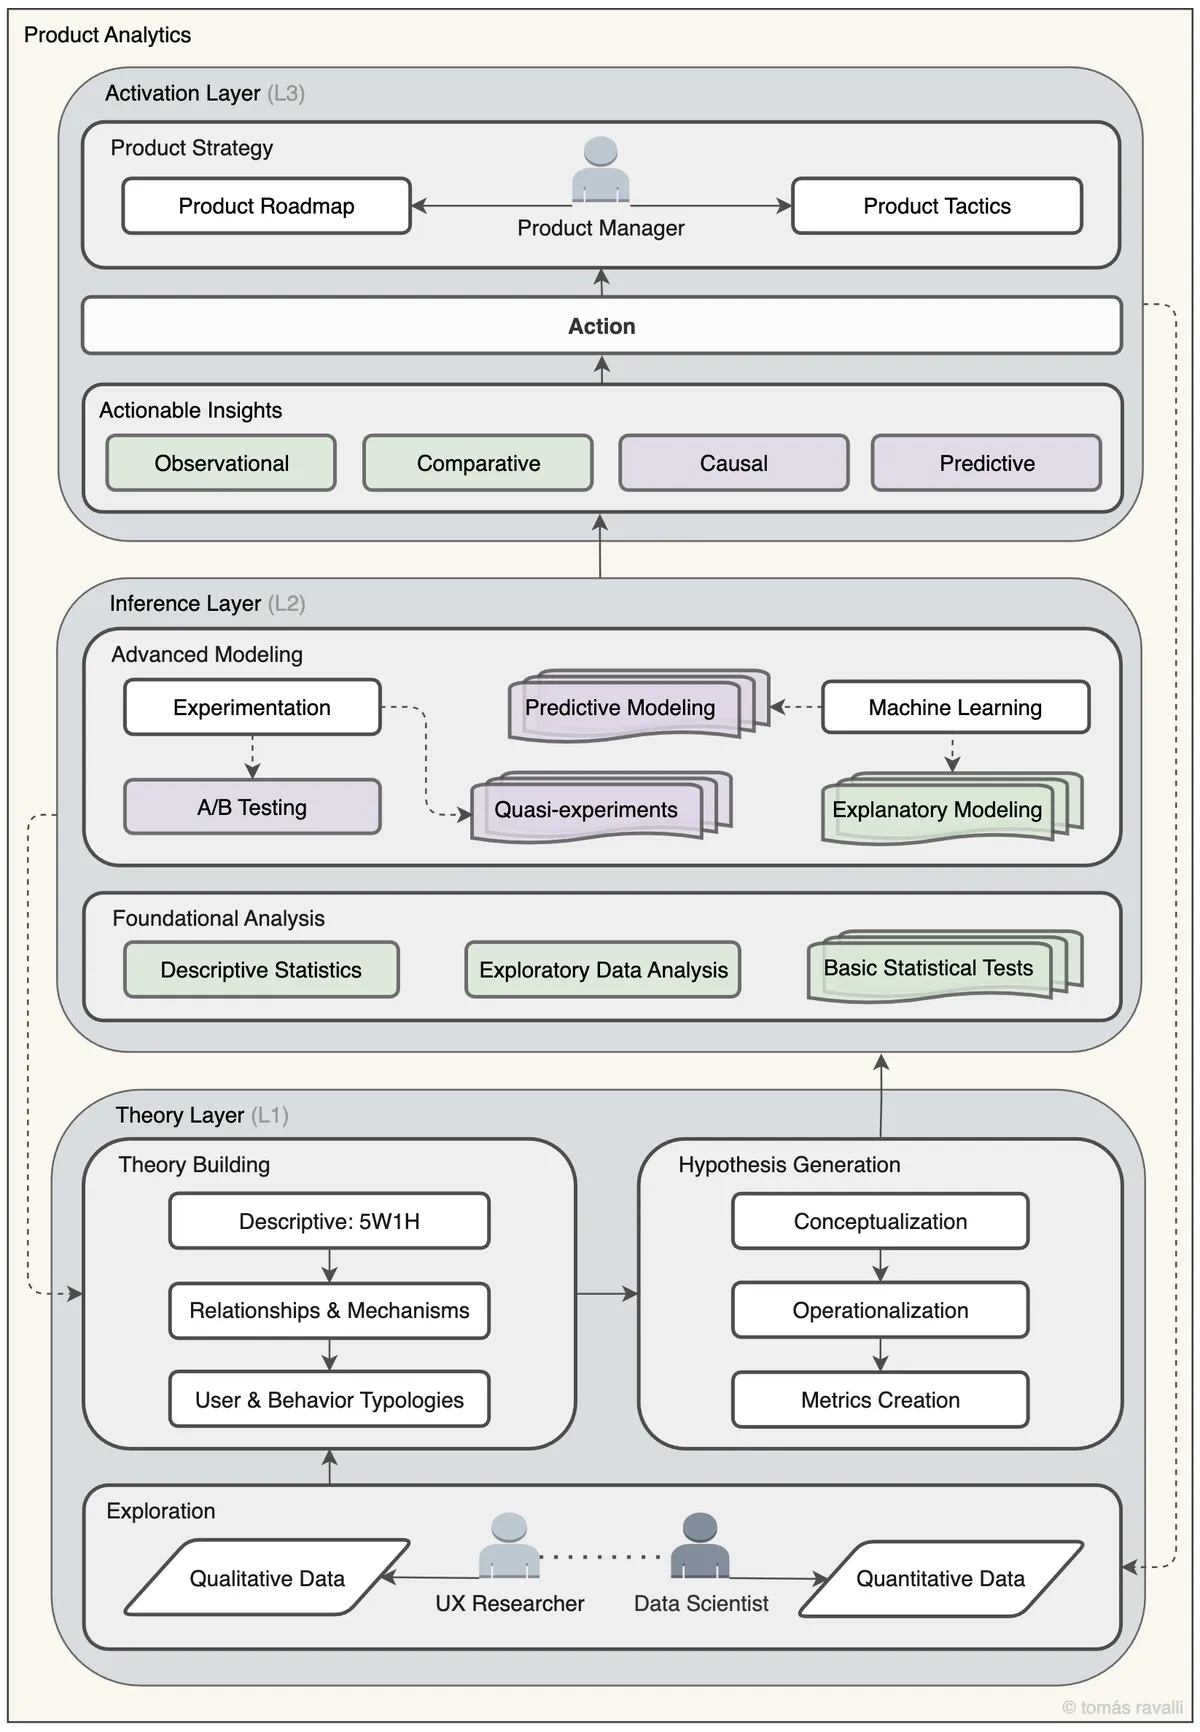
Fig. 1: Product Analytics Framework
Key Roles
While product analytics is a broad collaborative effort, this blueprint is powered by the distinct contributions of five key roles. Each role owns a critical part of the process, and their interaction is essential for turning data into impactful product changes.
| Role | Primary Layer(s) | Core Contribution |
|---|---|---|
| UX Researcher | Theory (L1) |
Provides Qualitative Data by conducting user interviews, surveys, and usability studies to uncover the motivations and pain points –the "why"– behind user behavior. |
| Data Scientist | Theory (L1) & Inference (L2) |
Supplies Quantitative Data and executes all analyses in the Inference Layer –from EDA to advanced modeling– to generate validated, actionable insights. |
| Data Engineer | Activation (L3) & Theory (L1) |
Executes the Action by building and shipping features. Also enables the blueprint by engineering the collection of the Quantitative Data needed for analysis. |
| UX Designer | Activation (L3) & Theory (L1) |
Translates Actionable Insights and strategy into tangible user experiences, designing the wireframes, prototypes, and high-fidelity mockups that engineers build. |
| Product Manager | Activation (L3) |
Consumes Actionable Insights to shape Product Strategy, define the Roadmap, and make evidence-based decisions, acting as the central hub for activating insights. |
Layer 1: Theory
The foundational layer where raw data is transformed into a structured understanding of user behavior. Its purpose is to ensure the right questions are asked and solid theories are formed before analysis begins. This layer synthesizes qualitative and quantitative data to build falsifiable theories and testable hypotheses.
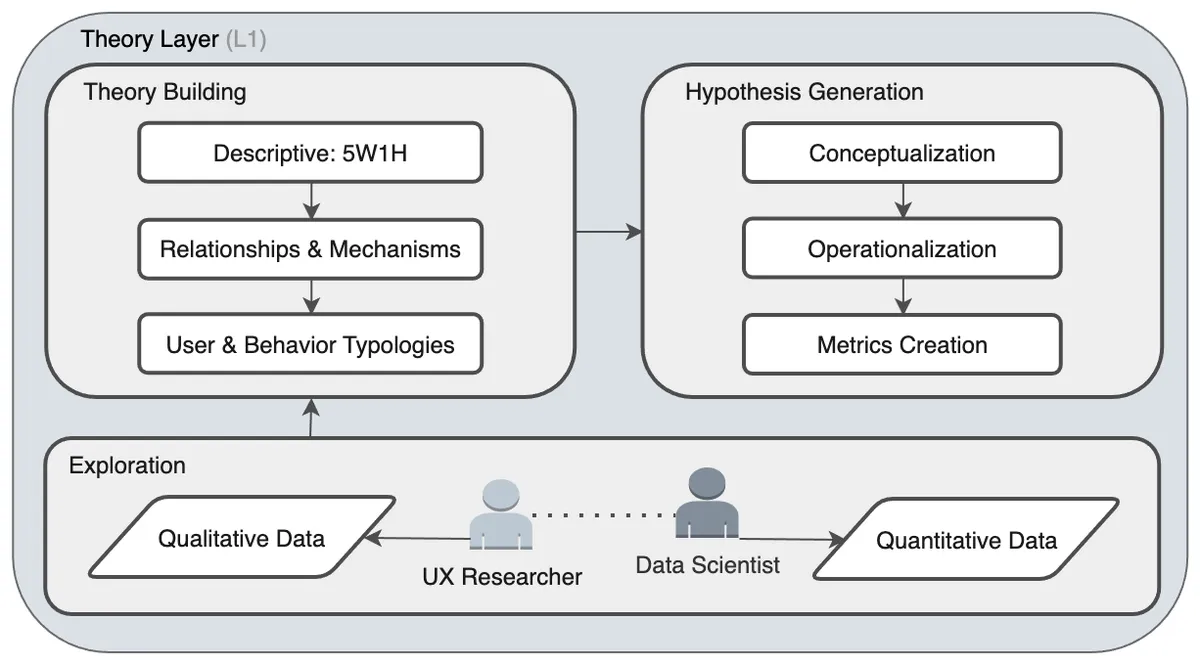
Fig. 2: Product Analytics Framework – Theory Layer (L1)
Main components:
- Exploration (L1·1): The process of gathering and exploring Qualitative Data and Quantitative Data to understand the landscape.
- Theory Building (L1·2): Creating conceptual models and User & Behavior Typologies to explain observed phenomena.
- Hypothesis Generation (L1·3): Translating theories into specific, measurable statements by defining abstract concepts (Conceptualization), determining how to measure them (Operationalization), and creating tangible Metrics.
Exploration (L1·1)
This initial phase is about gathering the raw materials for theory building. It involves a partnership between qualitative and quantitative disciplines to get a holistic view of the user experience.
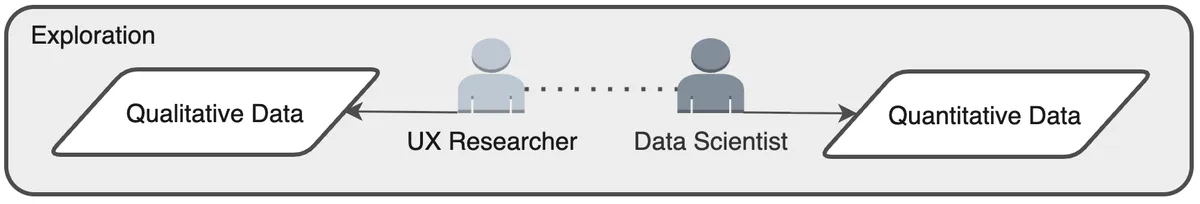
Fig. 3: Theory Layer – Exploration (L1·1)
| Data Type | Description | Purpose |
|---|---|---|
| Qualitative Data | Provides the "why" behind user actions. It includes insights gathered from methods that explore user motivations, opinions, and feelings. | To understand user goals, motivations, and pain points that are vital for explaining behavior. |
| Quantitative Data | Provides the "what" and "how" of user behavior at scale. It consists of measurable, logged events within the product. | To describe what users are doing in aggregate, identify patterns, and provide hard numbers for rigorous analysis. |
Theory Building (L1·2)
Once data is explored, the next step is to synthesize it into a coherent, explanatory mental model. This is not just a collection of facts, but a structured story about how and why users behave the way they do. A good theory is generalizable, objective, verifiable, falsifiable, and reproducible.
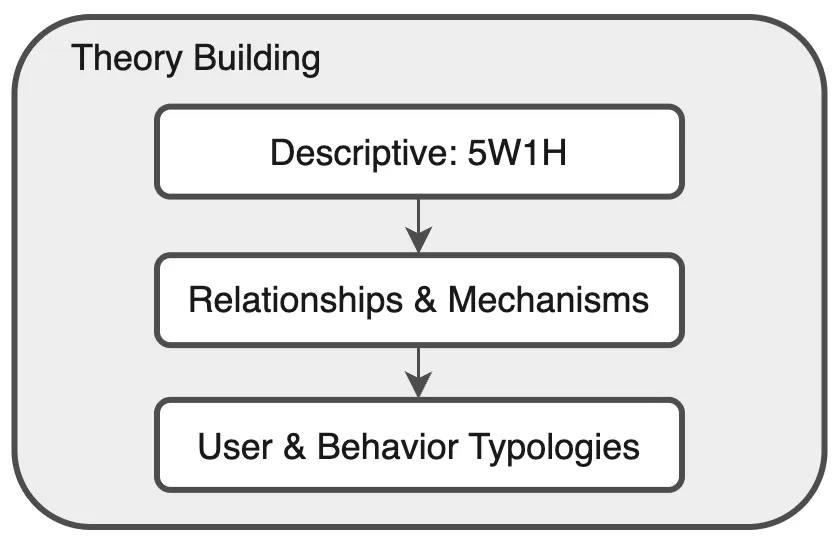
Fig. 4: Theory Layer – Theory Building (L1·2)
| Component | Description | Purpose |
|---|---|---|
| Descriptive (5W1H) | The first step in formalizing understanding by answering core questions: Who, What, Where, When, Why, and How. | To create a comprehensive, descriptive foundation before attempting to explain causal links. |
| Relationships & Mechanisms | Moves beyond simple description to define connections between behaviors and propose the mechanisms driving them. | To form the core of a causal argument that can be tested later. |
| User & Behavior Typologies | The practice of categorizing users or behaviors into distinct groups to manage complexity and generalize findings. | To build more nuanced models that recognize different user segments have different needs and behaviors. |
Hypothesis Generation (L1·3)
The final step in the Theory Layer, where abstract theories are translated into concrete, testable statements. It's the critical bridge between ideas and empirical testing.
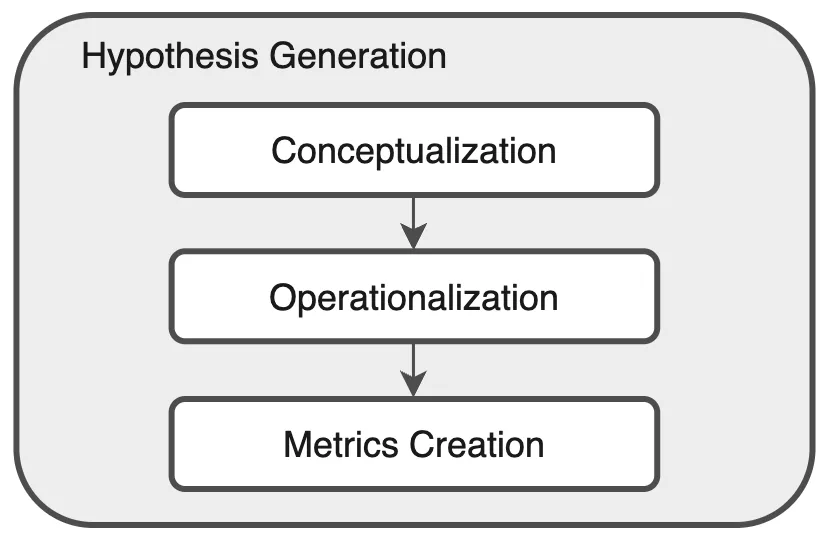
Fig. 5: Theory Layer – Hypothesis Generation (L1·3)
| Process | Description | Purpose |
|---|---|---|
| Conceptualization | Clearly defining abstract, often intangible, ideas like "user engagement" or "product stickiness". | To create a shared and precise understanding of the abstract concepts within the theory. |
| Operationalization | Determining how a defined concept can be measured by breaking it into its measurable dimensions. | To create a clear strategy for how to quantify an abstract idea. |
| Metrics Creation | Creating the specific, tangible indicators for each dimension, which can be different types of variables. | To produce the final, quantifiable metrics that will be used to test the hypothesis. |
Layer 2: Inference
The analytical core where hypotheses generated in the Theory Layer are rigorously tested against data. The primary goal is to generate validated insights by separating statistically significant findings from random noise. This layer applies the appropriate statistical methods to test hypotheses and generate one of four types of insights: Observational, Comparative, Causal, or Predictive.
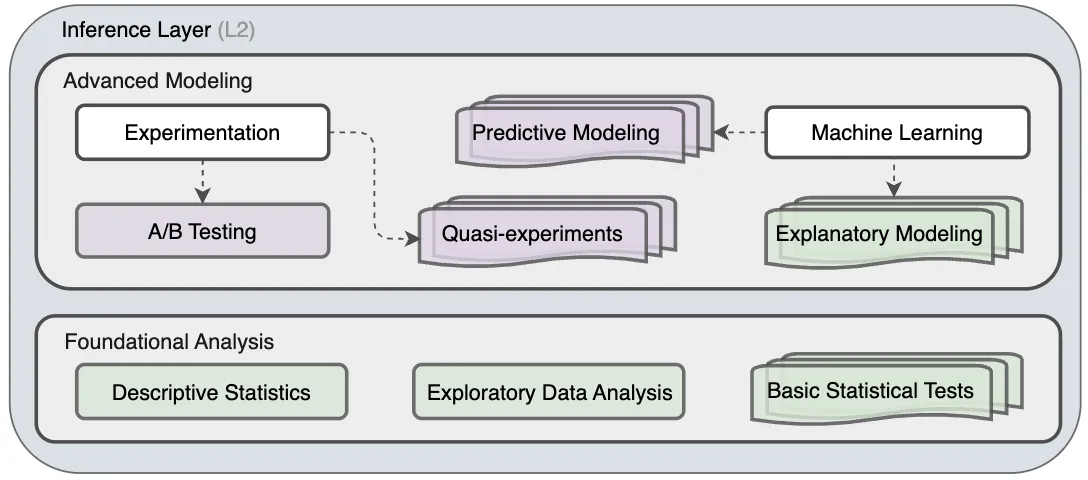
Fig. 6: Product Analytics Framework – Inference Layer (L2)
Main components:
- Foundational Analysis (L2·1): The engine for day-to-day business intelligence, using Descriptive Statistics, Exploratory Data Analysis (EDA), and Basic Statistical Tests to generate Observational and Comparative insights.
- Advanced Modeling (L2·2): The toolkit for answering complex strategic questions. It uses Experimentation (A/B tests), Quasi-experiments, and Machine Learning models to generate Causal and Predictive insights.
Foundational Analysis (L2·1)
It uses fundamental statistical techniques to describe the current state of the product and its users, generating Observational and Comparative insights.
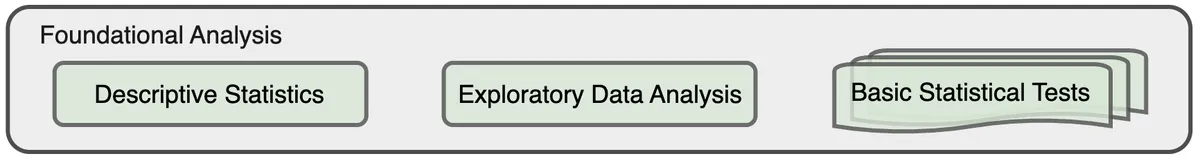
Fig. 7: Inference Layer – Foundational Analysis (L2·1)
| Method | Description | Example |
|---|---|---|
| Descriptive Statistics | Summarizes and describes the main features of a dataset, providing a quantitative overview of "what is happening". | Calculating the average revenue per user (ARPU), the median number of sessions per week, or the distribution of user ages. |
| Exploratory Data Analysis (EDA) | The process of visualizing data to discover patterns, spot anomalies, and check assumptions. | Creating a histogram of session durations to see if the distribution is normal or exponential, or a scatter plot to visualize relationships. |
| Basic Statistical Tests | Used to make inferences about a population from a sample, determining if observed differences are statistically significant. | Using a t-test to compare average spend between two user groups, or a chi-squared test to compare conversion rates. |
Advanced Modeling (L2·2)
It uses more sophisticated techniques to understand causality and predict future behavior, generating Causal and Predictive insights.
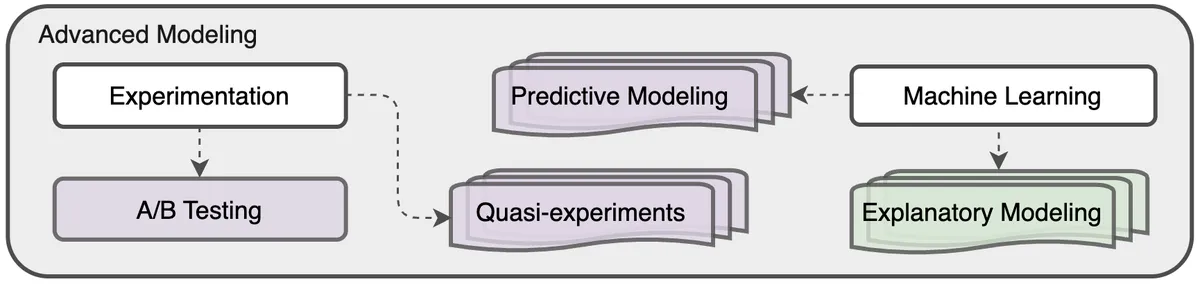
Fig. 8: Inference Layer – Advanced Modeling (L2·2)
| Method | Description | Example |
|---|---|---|
| Experimentation (A/B Testing) | The gold standard for establishing causal relationships by randomly assigning users to control and treatment groups. | Randomly showing 50% of users a green button and 50% a blue one to determine which color causes a higher click-through rate. |
| Quasi-experiments | Methods used to estimate causal effects when true randomization isn't feasible, leveraging naturally occurring circumstances. | Difference-in-Difference (DiD), Regression Discontinuity (RD), or Statistical Matching. |
| Predictive Modeling | Using algorithms to learn patterns from historical data to make forecasts about future events. Focused on correlation, not causation. | Building a logistic regression model to predict the probability that a new user will churn within their first 30 days. |
| Explanatory Modeling | Bridges the gap between predictive and causal analysis, explaining why an outcome occurred or which users are most affected. | Using Uplift Modeling to identify users whose behavior is most likely to be changed by a marketing message. |
Layer 3: Activation
The final and most critical layer, where analytical insights are translated into tangible business and product actions. The goal is to ensure that the rigorous work done in the Theory and Inference layers leads to meaningful product improvements and strategic alignment.
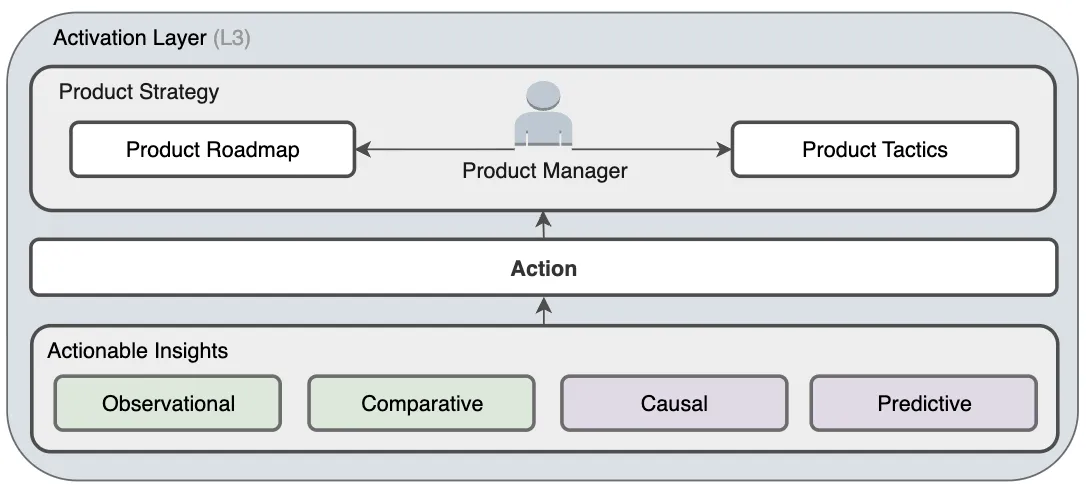
Fig. 9: Product Analytics Framework – Activation Layer (L3)
Main components:
- Actionable Insights (L3·1): The validated outputs from the Inference Layer, categorized as Observational, Comparative, Causal, or Predictive.
- Action (L3·2): The concrete implementation of an insight (e.g., shipping a feature, changing a user flow).
- Product Strategy (L3·3): The strategic influence of insights on the Product Strategy, Roadmap, and Tactics managed by the Product team.
Actionable Insights (L3·1)
This component represents the validated, high-confidence outputs from the Inference Layer. An insight is considered "actionable" when it can be used to drive a specific change in the product. These insights are the fuel for the Activation Layer.
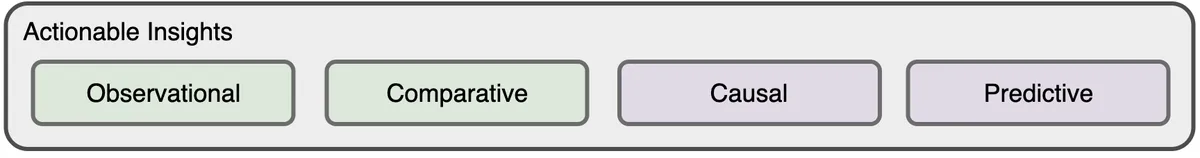
Fig. 10: Activation Layer – Actionable Insights (L3·1)
| Insight Type | Description | Typical Outcome |
|---|---|---|
| Observational | Based on the description of a phenomenon. | Leads to tactical improvements (e.g., "Users spend the most time on X feature, let's improve its design"). |
| Comparative | Related to a comparison between two or more groups. | Prompts further causal investigation (e.g., "X users retain better than Y users, let's find out why"). |
| Causal | Identifies a cause-and-effect relationship. | Directly informs feature or campaign decisions (e.g., "Banner A causes more signups than Banner B, let's use Banner A"). |
| Predictive | Related to forecasting future events. | Crucial for strategic planning and resource allocation (e.g., "We will need 5x server capacity by Q4"). |
Action (L3·2)
An Action is the concrete implementation of an insight – the bridge between the analytical world and the live product. The success of the entire blueprint hinges on the ability to effectively translate insights into well-executed actions.

Fig. 11: Activation Layer – Action (L3·2)
| Component | Description |
|---|---|
| Purpose | To change some aspect of the user experience, product functionality, or business process with the goal of improving key metrics. |
| Causal Insight example | An A/B test proves a simplified sign-up form increases conversion by 15%. → Ship the new form to 100% of users. |
| Observational Insight example | A user funnel analysis shows a 60% drop-off on the payment screen. → Prioritize a redesign of the payment screen. |
| Predictive Insight example | A churn model identifies a segment of at-risk users. → Launch a targeted re-engagement campaign for that segment. |
Product Strategy (L3·3)
The actions taken based on insights directly influence and shape the product's direction at all levels, from high-level vision to day-to-day execution. This component ensures that the product evolves based on evidence rather than solely on intuition.
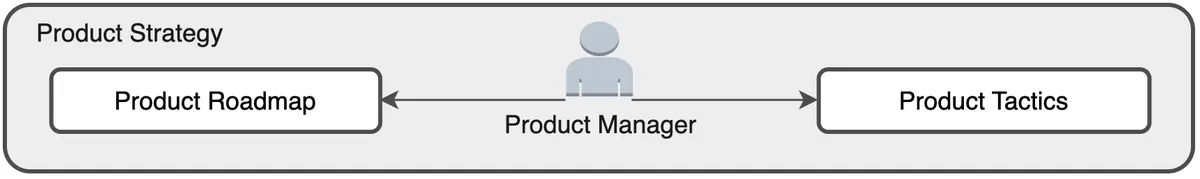
Fig. 12: Activation Layer – Product Strategy (L3·3)
| Strategic Artifact | Description | Impact of Insights |
|---|---|---|
| Product Strategy | The high-level plan for achieving the product's vision. | Insights validate or challenge the core assumptions of the strategy, potentially leading to major pivots. |
| Product Roadmap | The time-based plan for what features and initiatives will be built. | Insights provide the evidence needed to prioritize one feature over another, focusing resources on the highest-impact work. |
| Product Tactics | The smaller-scale, often short-term decisions made to achieve the roadmap's goals. | An insight can directly lead to a tactical change in a user flow, UI copy, or notification timing. |
Feedback Loops
The blueprint is not a linear process but a dynamic cycle. Two key feedback loops drive its continuous learning and adaptation.
1. The Macro-Cycle
Activation Layer → Exploration
This is the primary engine of product development, driving the iterative evolution of the product itself.
Every Action taken in the Activation Layer (e.g., shipping a feature) generates new quantitative (usage data) and qualitative (user feedback) data. This new information becomes the raw material for the next cycle of Exploration – ensuring that the real-world outcomes of every action inform the next round of analysis and strategic planning.
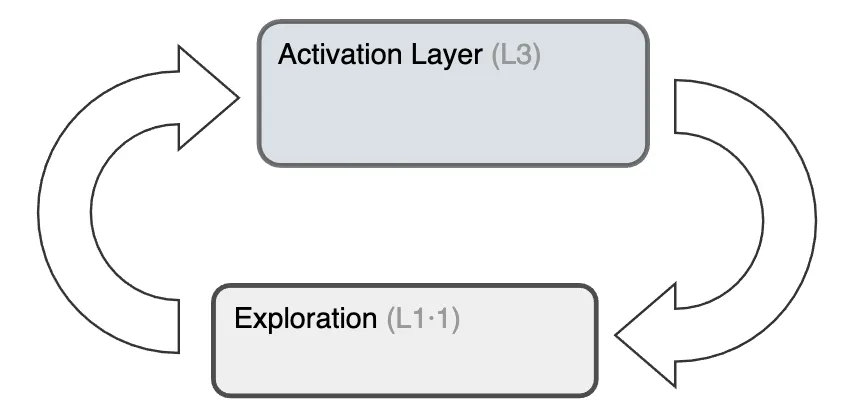
Fig. 13: The Macro-Cycle Feedback Loop
2. The Theory Refinement Cycle
Inference Layer → Theory Building
This loop ensures the team's understanding of its users is constantly updated with rigorous evidence, making the foundational theory more accurate over time.
Validated insights from the Inference Layer are used to challenge and refine the conceptual models in the Theory Building phase. A finding that contradicts a hypothesis signals that the underlying theory needs revision – making the blueprint self-correcting by forcing a disciplined re-evaluation of assumptions based on analytical outcomes.
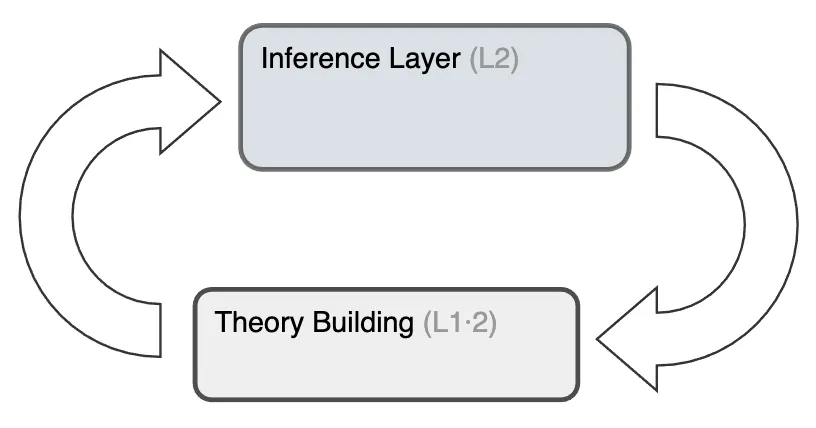
Fig. 14: The Theory Refinement Feedback Loop
References
- Rodrigues, J. (2021). Product Analytics: Applied Data Science Techniques for Actionable Consumer Insights. Addison-Wesley.
- Croll, A., & Yoskovitz, B. (2013). Lean Analytics: Use Data to Build a Better Startup Faster. O'Reilly Media.
- Meadows, D. H. (2008). Thinking in Systems: A Primer. Chelsea Green Publishing.
© 2023 trm