Is Maldini a Superforecaster?
Julio Maldonado ("Maldini") is one of Spain's most recognised football journalists. His YouTube channel @mundomaldini has been part of my weekly routine for years – he covers tactics, analyses, history across European football. But there's one thing he does that's measurable: he assigns explicit probabilities to match outcomes.
Not "I think Barça will win". He says home 60%, draw 25%, away 15%. Every week, for every match he covers. On camera. That's a prediction you can measure and evaluate post-match.
So I built a pipeline to do that.

The benchmark comes from Philip Tetlock's Superforecasting research. The Good Judgment Project showed that the best forecasters consistently score below 0.20 on the Brier scale – a metric that penalises both inaccuracy and overconfidence. Lower is better. Perfect is 0.
What's a Brier score?
A Brier score measures how close your probabilistic predictions are to what actually happened. Predict 80% home win and the home team wins – good. Predict 80% home win and the away team wins – you get punished harder than spreading probabilities more evenly.
The formula: take the squared difference between predicted probabilities and actual outcome (1 for what happened, 0 for what didn't), sum them. For a three-outcome match:
Here are the benchmarks:
| Benchmark | Brier Score |
|---|---|
| Naive baseline (guess 1/3 each outcome) | 0.222 |
| Typical football bookmaker | ~0.19 |
| Superforecaster threshold | < 0.20 |
| Perfect forecaster | 0.00 |
Someone assigning 33% to each outcome scores 0.222 by default. Beating that is easy. Beating the bookmakers – who combine thousands of bettors' money into a single price – is hard.
The verdict
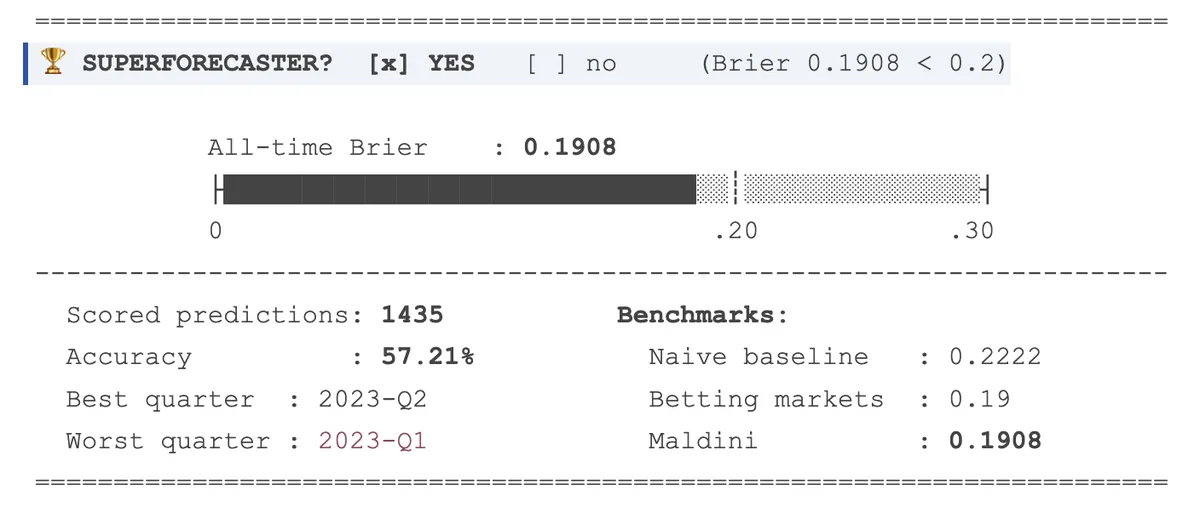
Maldini's all-time Brier score across 1,435 scored predictions is 0.1908 at the moment of this snapshot. He clears the threshold. One person, performing at the level of the betting markets.
The dataset spans 2022-Q4 to the present, covering LaLiga, Champions League, Copa del Rey, international tournaments. At 1,400+ predictions, the average has had room to stabilise.
Is it consistent?
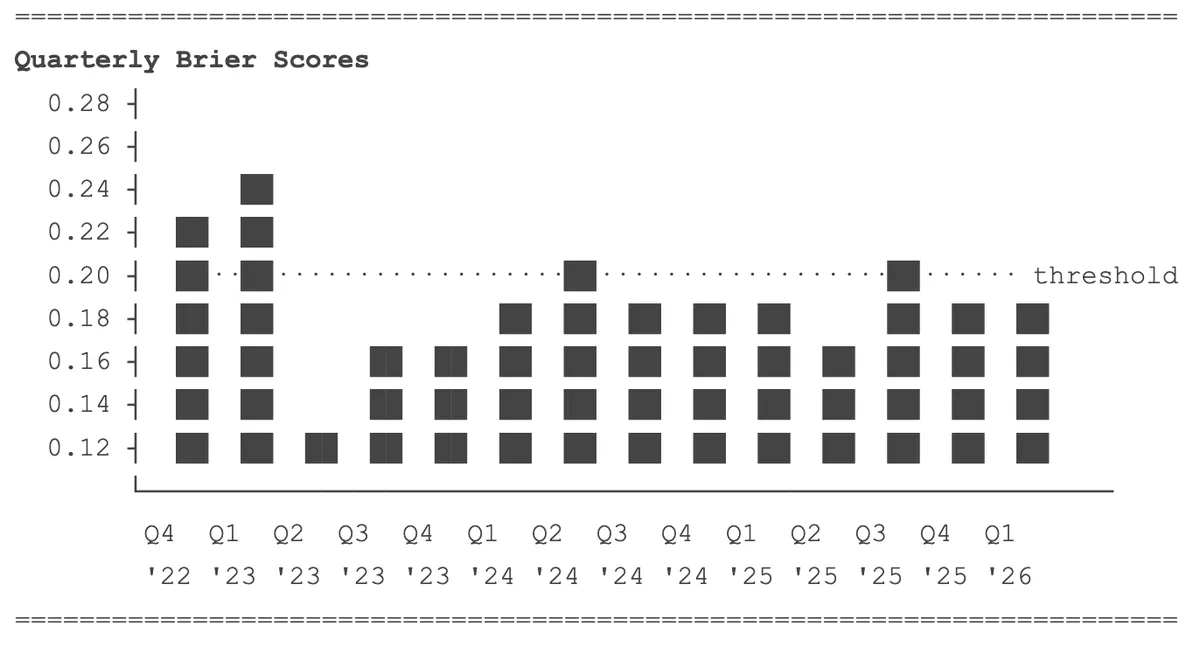
Most quarters land below 0.20. Two don't: 2023-Q1 and 2024-Q3. Every other quarter clears it.
A forecaster who averages 0.19 but swings between 0.10 and 0.28 is different from one who sits consistently around 0.18–0.19. Maldini's chart shows the second pattern with occasional spikes. Even Tetlock's superforecasters have bad stretches. The trend matters more than any single quarter, and the trend is flat and below the line.
Where does he struggle?
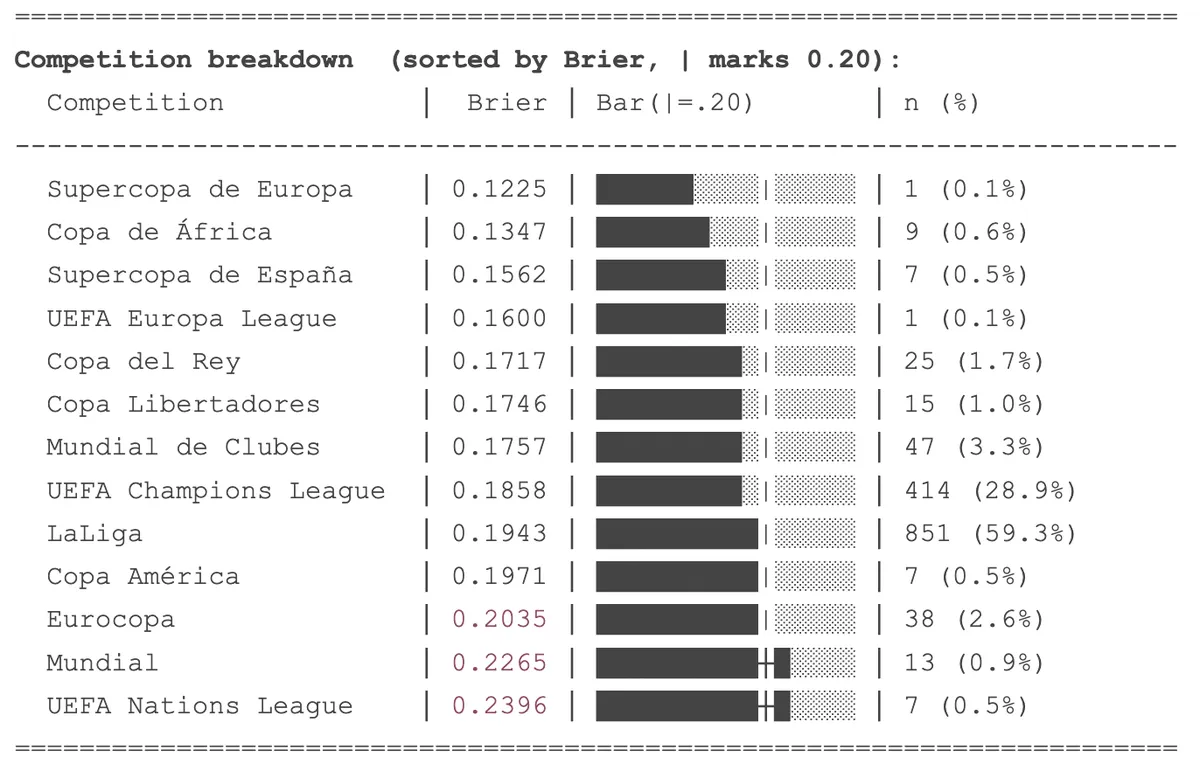
The competition breakdown maps to expertise and familiarity.
LaLiga – 59% of all predictions, Brier 0.194. He watches every match, knows every squad. This is the football he knows best.
Champions League – 29% of predictions, Brier 0.186. His best performance by volume.
The outliers: World Cup (0.227, n=13) and Nations League (0.240, n=7). International tournaments are harder to predict – less recent form data, higher variance in squads, one-off matches. The scores are above the threshold, but the samples are too small to draw conclusions.
The recent window
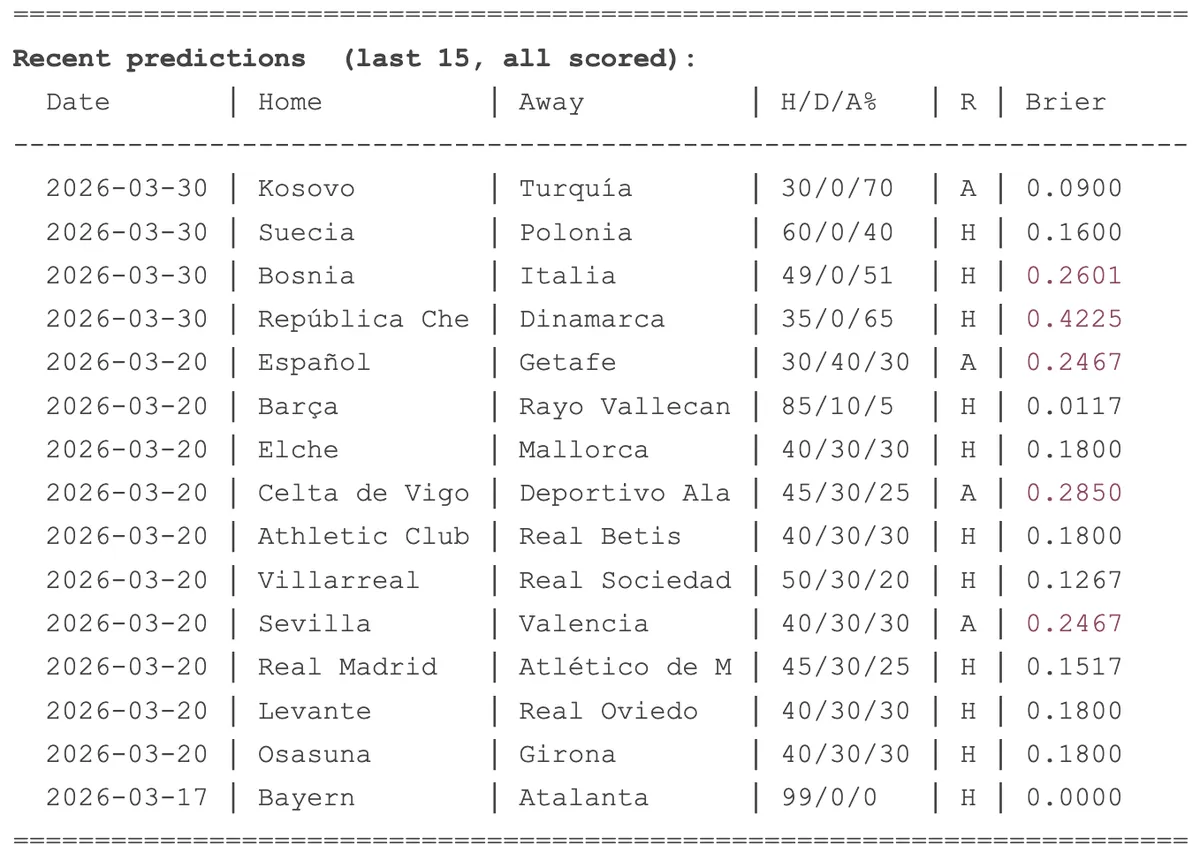
Individual predictions show the full range. Bayern–Atalanta: 99% home, went home. Brier: 0.000. Czech Republic–Denmark: 65% away, home team won. Brier: 0.423.
Single matches are noisy. A confident wrong call gets punished hard. The average smooths this out – that's the point of tracking 1,400+ predictions instead of picking examples.
How it works
The pipeline turns YouTube videos into scored predictions through four stages.
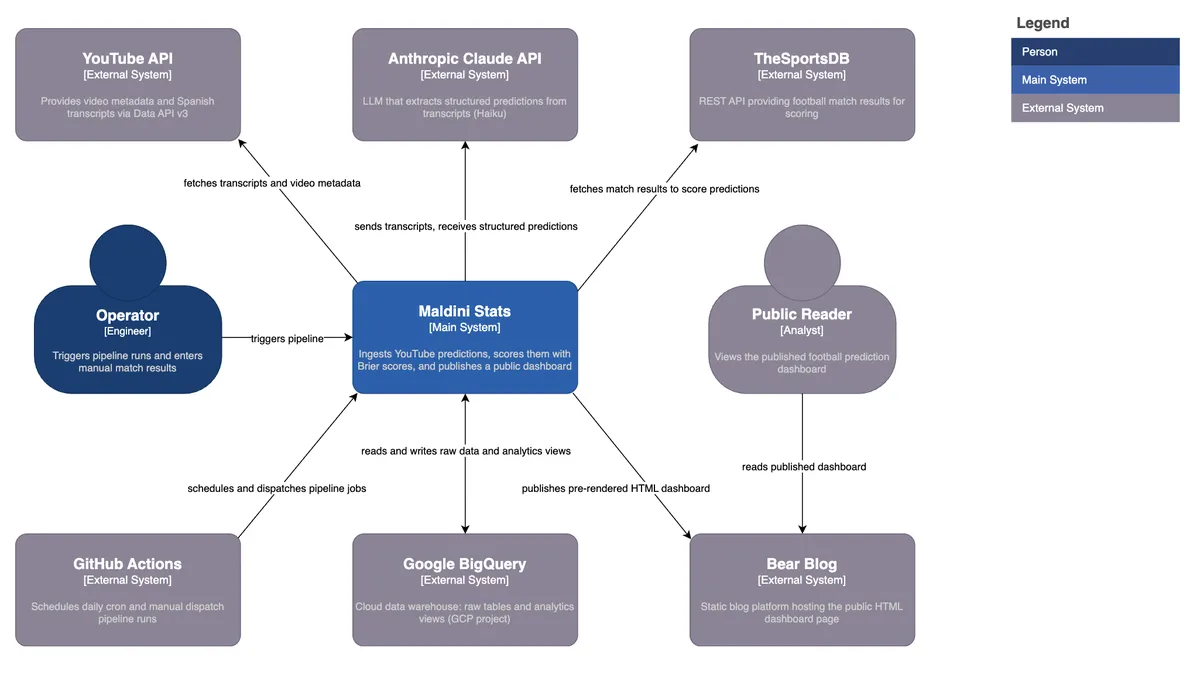
Ingestion. A YouTube video URL goes in. The YouTube Data API fetches metadata, and youtube-transcript-api pulls the Spanish transcript. One row per video lands in a raw BigQuery table.
Extraction. Claude Haiku claude-3-5-haiku-20241022 reads the transcript and extracts structured predictions: home team, away team, competition, match date, and the home/draw/away percentages. Maldini's predictions are embedded in natural speech, sometimes implicit, sometimes spread across sentences. The LLM handles this well. One row per prediction.
Results. TheSportsDB API provides actual match results. Fuzzy team matching handles the messy reality of team names – stripping accents, normalising prefixes like "Real" and "Atlético", applying Spanish-to-English substitutions. For predictions without an explicit match date, a 45-day window from the video's publish date finds the right fixture.
Scoring. BigQuery views handle all transformations: staging, intermediate joins, and the final analytics layer. fct_predictions computes the Brier score per prediction, with a 3-outcome formula for regular matches and a 2-outcome variant for knockouts where Maldini assigns 0% to the draw. Summary views feed the dashboard.
The dashboard itself is pre-rendered HTML – a static page published to Bear Blog. GitHub Actions orchestrate everything: a daily cron at 08:00 UTC runs extraction and results, manual triggers handle new video ingestion. Raw tables are append-only – if the SQL logic changes, you fix the view, not the source data.
The full pipeline is open source: github.com/tomas-ravalli/maldini-stats
Closing
Most expertise goes unmeasured. Analysts make calls, journalists predict outcomes – but almost none are specific enough to be scored. Maldini is an exception. He puts numbers on the table every week, and those numbers can be evaluated.
This project started as a question – is he actually good? – and became a pipeline. The answer is yes.
⧉ Live dashboard ⧉ Source code
© 2026 trm